
TL;DR
Researchers have created a new map of the world where each territory is defined by proximity to the nearest capital city using spherical Voronoi diagrams. This approach changes traditional borders and offers a new perspective on global geography.
A new global map has been generated that redraws country territories based on the closest capital city, using spherical Voronoi diagrams that account for Earth’s curvature. This development offers a novel way to understand geographic proximity and territorial boundaries, with potential implications for geographic analysis and political geography.
The map was created using data from Natural Earth, specifically the 1:10 million cultural vectors of populated places, including capital cities. The method employs spherical Voronoi diagrams, which calculate regions based on the shortest distance to each capital, considering Earth’s curvature. This results in a map where territories are defined not by traditional borders but by proximity to the nearest capital city.
Unlike conventional borders, which are often based on historical, political, or cultural factors, this approach emphasizes geographic closeness. The project is inspired by the ‘United States of Voronoi,’ a similar concept applied within the United States. The resulting map is available for exploration and has been shared on Hacker News, prompting discussions about its implications for geography and geopolitics.
Experts note that such maps could influence how we visualize global relationships, but they also acknowledge that this method does not account for political realities, such as sovereignty or historical borders. The map is primarily a geographic tool that highlights proximity rather than political boundaries.
Implications of Redefining Territories by Proximity
This new mapping approach challenges traditional notions of national borders by emphasizing geographic proximity to capitals. It could influence geographic education, data visualization, and even policy discussions by providing a different perspective on territorial relationships. However, it also raises questions about the relevance of such maps for political and cultural identity, which are often rooted in historical borders.

Swiftmaps World Premier Wall Map Poster Mural 24h x 36w
FOLDED EDITION – portable 8×10 inch folded size
As an affiliate, we earn on qualifying purchases.
As an affiliate, we earn on qualifying purchases.
Background on Voronoi Diagrams and Geographic Mapping
Voronoi diagrams are mathematical constructs used to partition space based on proximity to a set of points—in this case, capital cities. Traditionally used in fields like meteorology and urban planning, their application to global mapping is relatively recent. The concept was popularized in a project called ‘United States of Voronoi,’ which applied similar principles within the U.S. to visualize regions based on proximity to state capitals.
The recent development extends this idea to a global scale, using spherical geometry to account for Earth’s curvature, which improves the accuracy of the regions. The approach has gained attention on Hacker News, where users discussed its potential and limitations. It is not intended to replace political borders but to offer an alternative geographic perspective.
“Using spherical Voronoi diagrams provides a more accurate representation of proximity on a global scale, considering Earth’s curvature.”
— an anonymous researcher
globally accurate spherical Voronoi map
As an affiliate, we earn on qualifying purchases.
As an affiliate, we earn on qualifying purchases.
Limitations and Disputed Aspects of the Map
It is not yet clear how widely this map will influence geographic or political analysis, or if it will be adopted in official contexts. Critics may argue that proximity-based borders oversimplify complex geopolitical realities, and the map does not account for sovereignty, cultural borders, or historical claims. Additionally, the accuracy of the data depends on the precision of the underlying geographic datasets and the implementation of the Voronoi algorithm on a global scale.
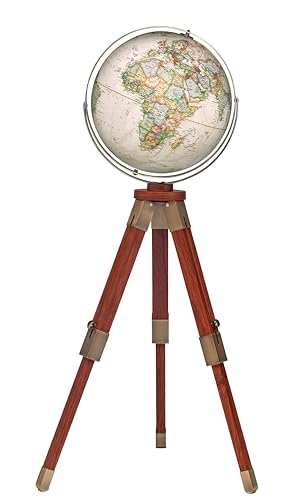
Eaton III 16" Diameter, National Geographic floor-standing globes is a beautiful home décor piece and hands-on reference guide for geography. This stylish globe with updated cartography will be the center piece for any room in your home or office. Also, the adjustable tripod stand allows for the globe to be displayed at a height that will make your viewing the most comfortable and easily adapting to different locaitons in your room. Thousands of place names give an accurate view of contemporary political boundaries. Raised relief helps distinguish topographic features around the world. Its antique brass plated gyro-matic meridian and hardware perfectly match the walnut stained hardwood legs and add to the look of this handsome tripod stand.
Solid wood construction with brass fittings
As an affiliate, we earn on qualifying purchases.
As an affiliate, we earn on qualifying purchases.
Potential Applications and Future Developments
Researchers plan to explore how this approach can be integrated into geographic information systems (GIS) and used for educational purposes. Further studies may compare these proximity-based regions with traditional borders to analyze discrepancies and insights. There is also potential for applying similar methods to regional planning, logistics, and understanding global interconnectedness. Ongoing discussions on Hacker News suggest interest in refining the technique and assessing its broader implications.

Updated Peters Projection World Map | Laminated 36" x 24” Map | Developed by Arno Peters | Most Proportionally-Accurate Land Mass Depiction | Country Size & Scale is True, Unlike Most Maps | Major Countries, Cities, & Bodies of Water Labeled
ONLY UPDATED PETERS PROJECTION WORLD MAP – Unlike other out-of-date Peters Projection style maps, our Updated Peters World…
As an affiliate, we earn on qualifying purchases.
As an affiliate, we earn on qualifying purchases.
Key Questions
How does this map differ from traditional world maps?
This map redraws territories based on the closest capital city using spherical Voronoi diagrams, emphasizing geographic proximity rather than political borders.
Can this map be used for political or administrative purposes?
Currently, it is primarily a geographic visualization tool and does not reflect political sovereignty or historical borders. Its use in official contexts is limited.
What are the technical methods behind this map?
The map uses spherical Voronoi diagrams that account for Earth’s curvature to partition space based on proximity to each capital city.
Why is this map considered significant?
It offers a new perspective on global geography, highlighting proximity relationships that are often overlooked in traditional borders, and stimulates discussion about how we visualize and understand territorial relationships.
Source: Hacker News